
How we built MERALCO Brownout Map for the Philippines

Power interruptions are part of daily life for many Filipinos — from scheduled maintenance to sudden brownouts caused by weather or system issues.
What most of us want to know is how often these outages happen in our area, and which places are most affected.
At Lupain.AI, we built the Power Outages Map so people can easily see and understand how power interruptions affect their communities.
Using data sourced from Electrical Distributors (EDs) covering 2024 to 2025, we built an interactive map that highlights where power interruptions occur most frequently across the Philippines — presented in a way that’s clear and easy to explore.
We started with MERALCO data, which represents around 33% of all electricity consumers in the country, and we’re expanding to include other distributors to give a fuller national picture over time.
Making Power Data Useful for Everyone
Behind every dot on the map is a story — a record of an outage that affected homes, offices, and communities.
Each entry shows:
- The number of recorded outages
- Which city or municipality was affected
- A quick link to official Meralco advisories
- Practical safety reminders and tips for dealing with outages
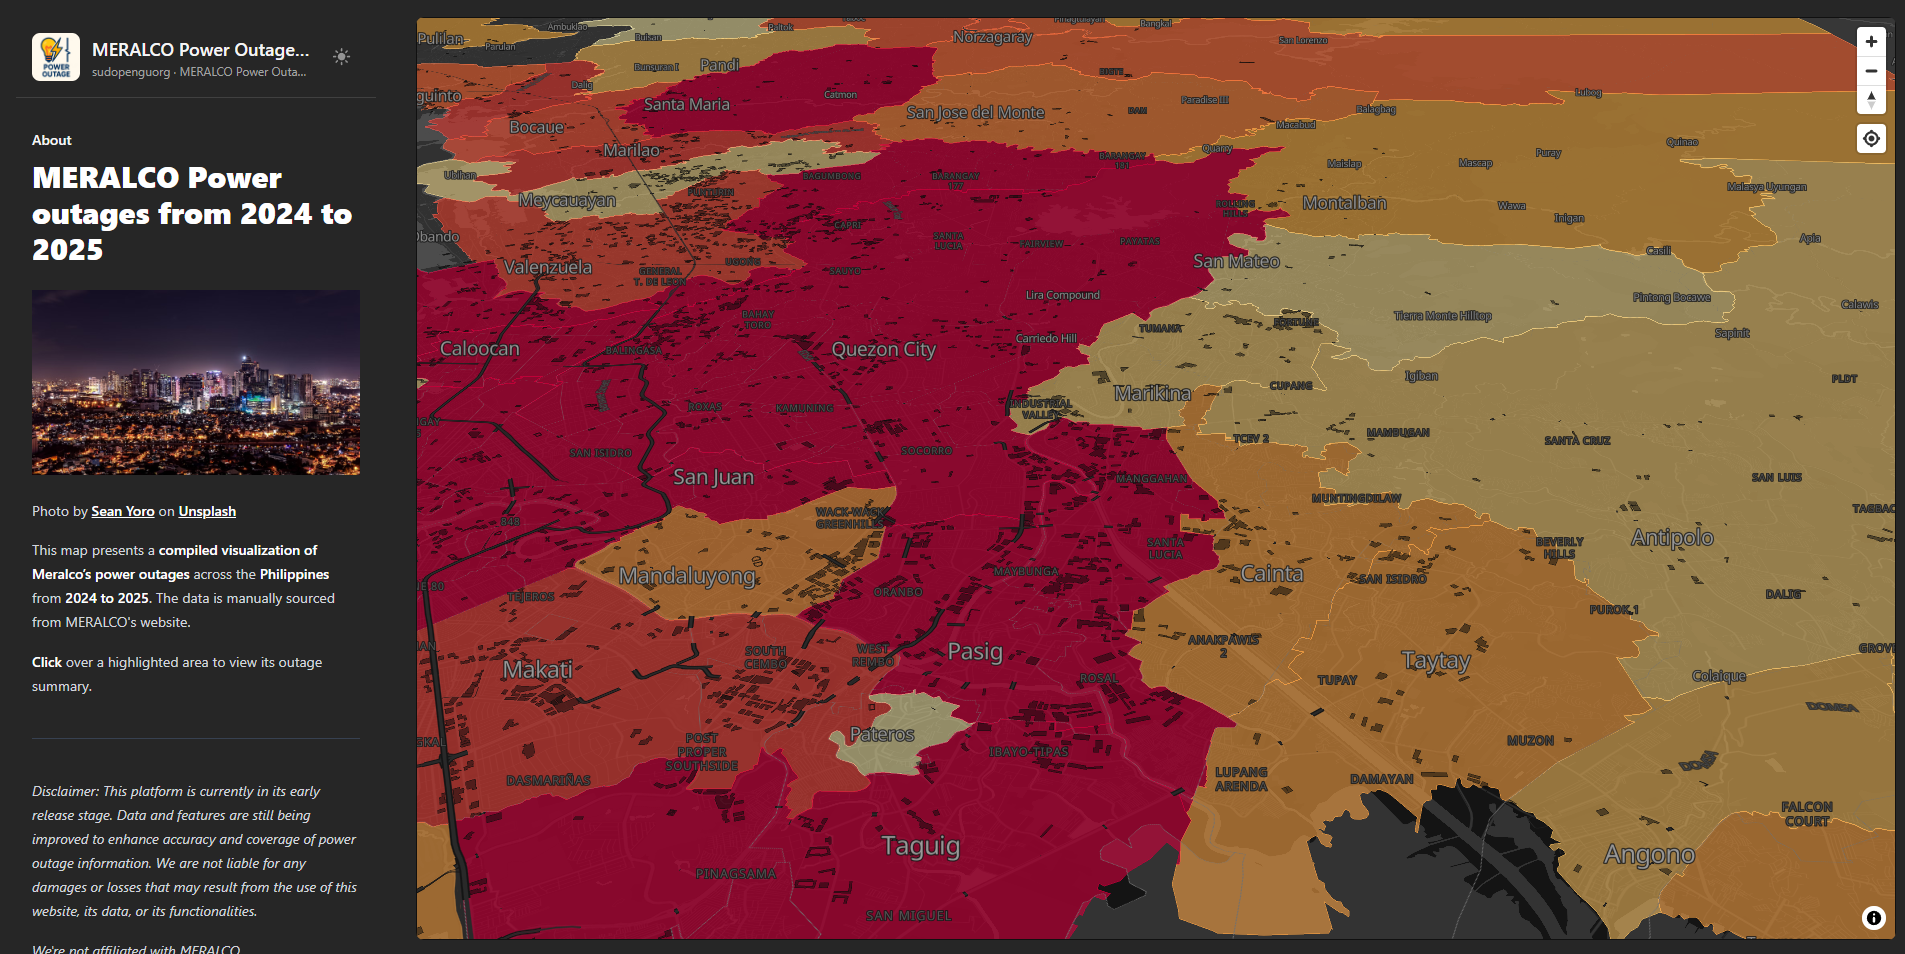
The map helps you see which areas are most affected, how often outages happen, and which communities experience the most frequent interruptions.
Powered by the Lupain.AI Map Engine
This map runs on the Lupain.AI Map Engine, the same technology that powers our earthquake risk visualizations.
It’s designed so teams — from community leaders to disaster response units — can upload, update, and publish geospatial data directly from a browser without needing coding skills or technical expertise.
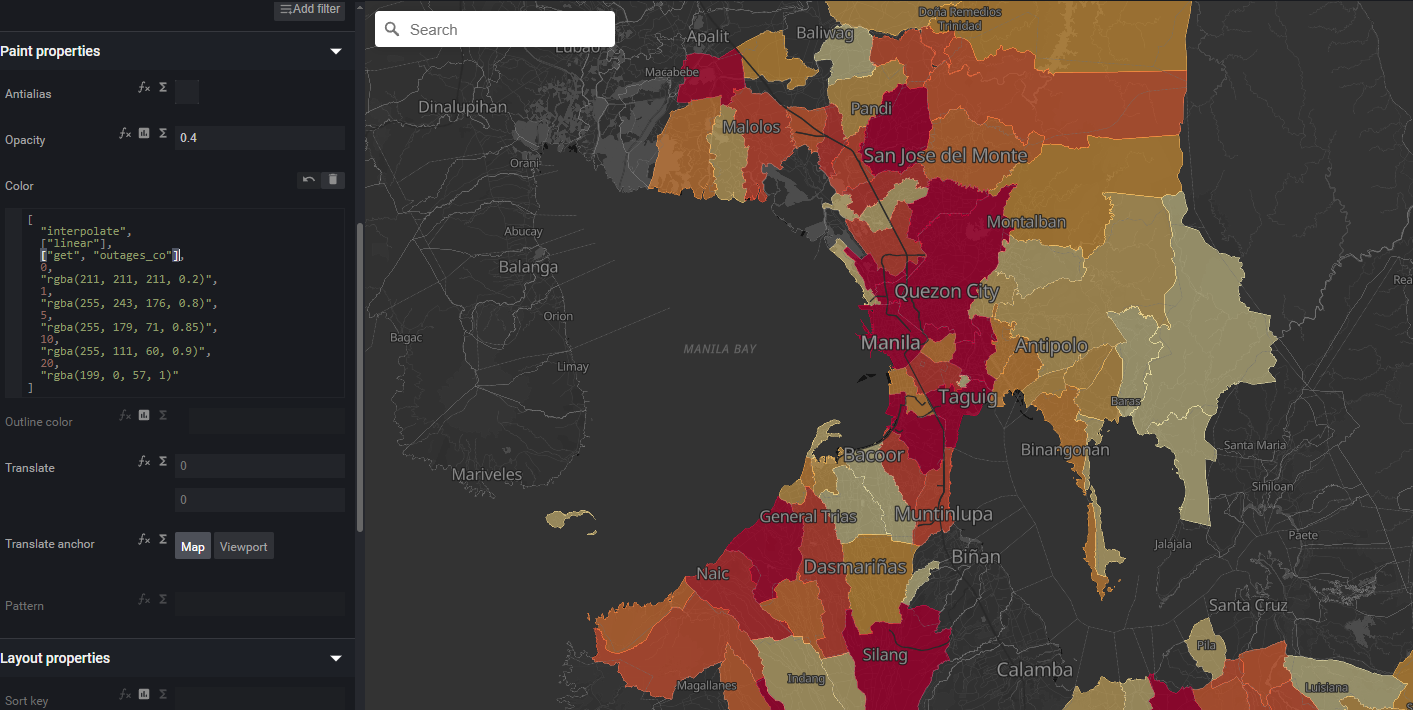
Each city and municipality on the map is color-coded based on the number of recorded outages.
From places with few interruptions to areas that experience frequent brownouts, users can quickly get the full picture at a glance.
Information You Can Act On
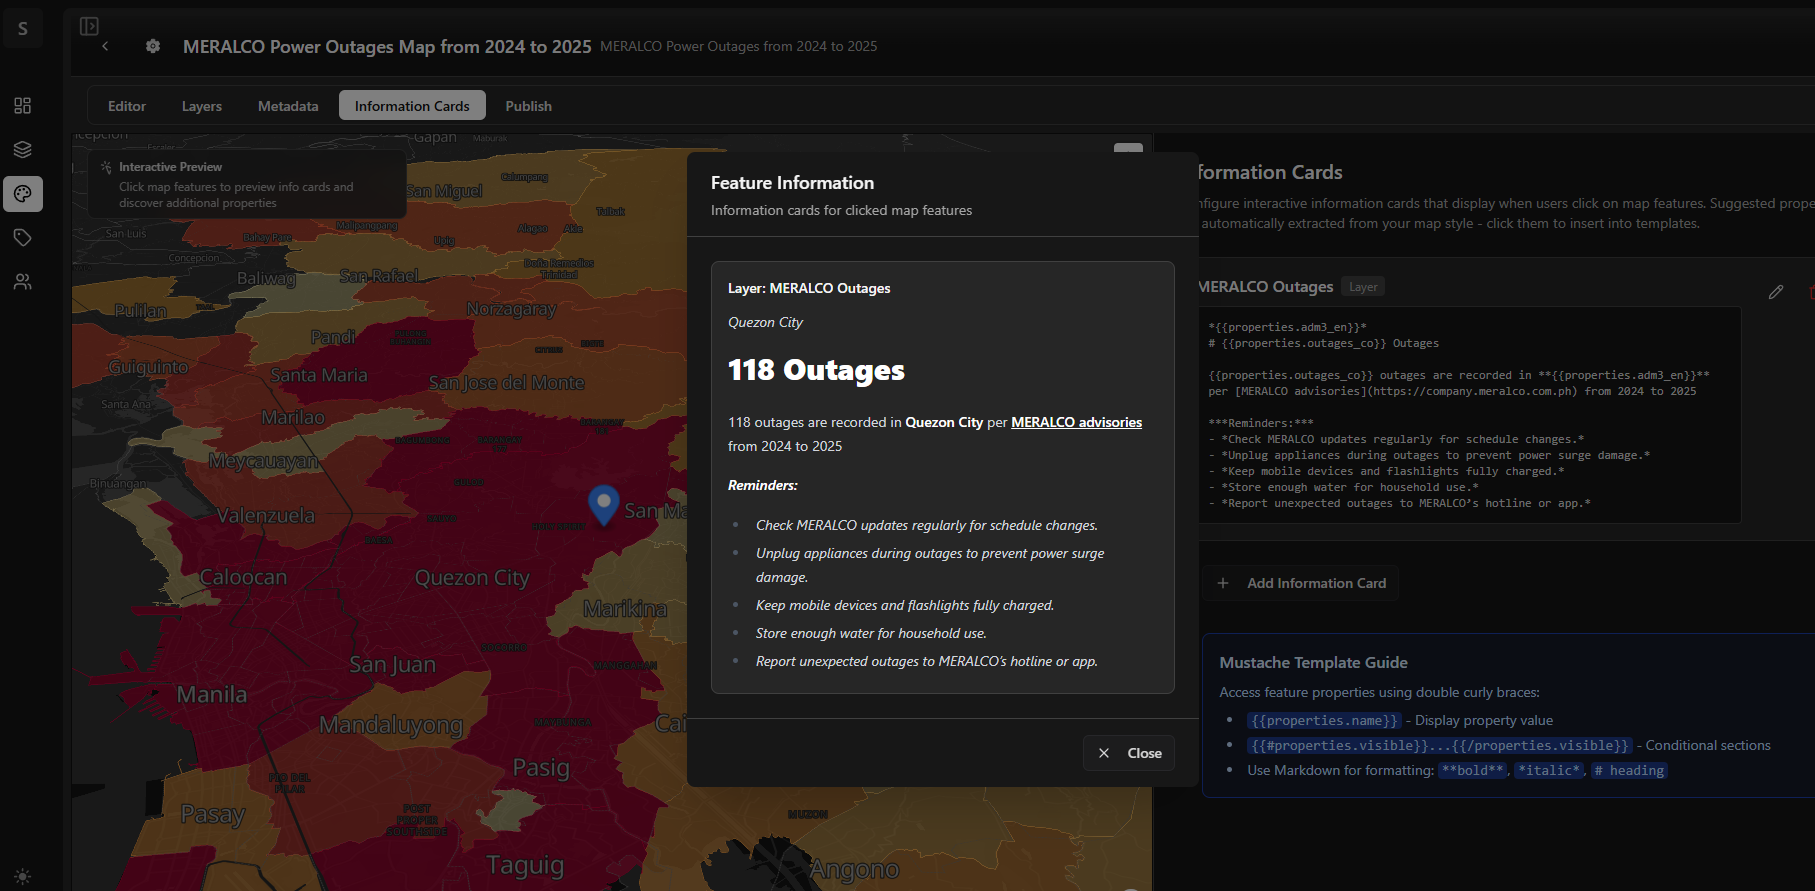
Click on any point on the map, and you’ll see an information card that summarizes key details — like the location name, outage count, and region.
These cards automatically update as new data comes in, ensuring that what you see is always current and accurate.
What sets this apart is the customizability — unlike other solutions, these cards can be easily tailored to highlight the specific information you need, without being hardcoded. This flexibility makes it easier for anyone — from a researcher to a resident — to understand what’s happening, without having to sift through complex reports or technical data.
Simple, Shareable, and Always Evolving
Once the data is ready, the map can be published instantly — making it useful during maintenance schedules, emergency updates, or even community information drives.
Our goal is to turn raw data into something that helps people prepare, plan, and stay informed.
The map will continue to grow as more outage data is added, helping everyone stay aware of power reliability across Meralco’s service areas.
You can explore the map here:
👉 lupain.ai/sudopenguorg/meralco
What’s Next?
We’re continuing to expand the Power Outages Map beyond MERALCO’s coverage.
Next, we’re integrating outage data from the Visayan Electric Company (VECO) — giving residents in the Visayas region clearer insights into local power reliability and service interruptions.
Join Us in Building Better Access to Information
At Lupain.AI, we believe that open, accessible data empowers communities.
If you share that vision — whether you’re a developer, researcher, or simply someone who wants to make local data more useful — we’d love to collaborate with you.
Check out open opportunities at blog.lupain.ai/careers